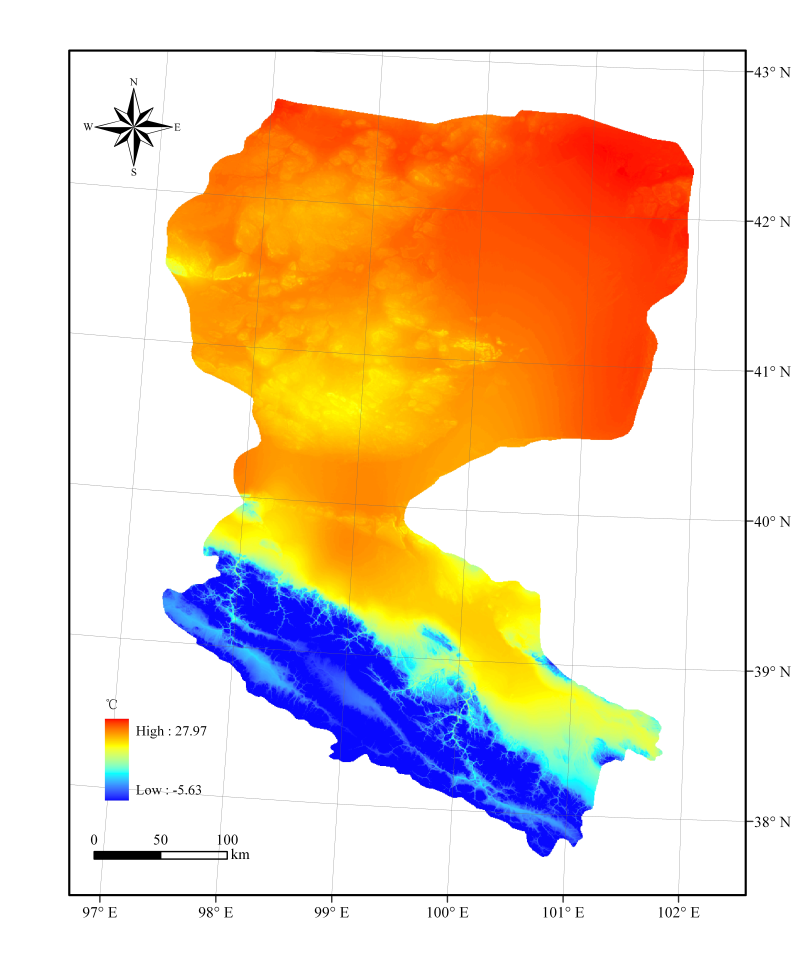
Monthly mean temperature for the period (1961-2010)

Based on the data information of 21 regular meteorological observation stations in Heihe River Basin and its surrounding areas and 13 national benchmark stations around Heihe River provided by the data management center of Heihe plan, the daily air temperature is statistically sorted out, and the monthly air temperature data of 1961-2010 for many years is calculated, and the spatial stability analysis is carried out to calculate the coefficient of variation. If the coefficient of variation is greater than 100%, then Calculate the relationship between the station and geographical terrain factors by geographical weighted regression, and get the monthly temperature distribution trend; if the coefficient of variation is less than or equal to 100%, calculate the relationship between the station temperature value and geographical terrain factors (longitude, latitude, elevation) by ordinary least square regression, and get the monthly temperature distribution trend; use HASM (high accuracy surface modeling) for the residual after removing the trend Method). Finally, the monthly average temperature distribution of the Heihe River Basin in 1961-2010 is obtained by adding the trend surface results and the residual correction results. Time resolution: average monthly temperature for many years from 1961 to 2010. Spatial resolution: 500M.
Copyright & License
Heihe River Basin + month + data type
Data Citations
Related Literatures:1. Zhao, N. , Yue, T. X. , Zhou, X. , Zhao, M. W. , Liu, Y. , Du, Z. P., & Zhang, L. L. (2017). Statistical downscaling of precipitation using local regression and high accuracy surface modeling method. Theoretical and Applied Climatology, 1: 1-12.(View Details)
2. TianXiang Yue. 2011. Surface Modelling: High Accuracy and High Speed Methods. New York: CRC Press (Taylor & Francis group)(View Details)
3. Na Zhao, Tiangxiang Yue, Mingwei Zhao, Zhengping Du, Zemeng Fan, Chuanfa Chen. Sensitivity studies of a high accuracy surface modeling method. SCIENCE CHINA Earth Sciences. 2014, 57(1):1-11.(View Details)
4. Zhao N, Yue TX ,2014. A modification of HASM for interpolating precipitation in China. Theor Appl Climatol, 116: 273-285.(View Details)
5. Yue TX, Zhao N, Ramsey RD, Wang CL, Fan ZM, Chen CF, Lu YM, Li BL (2013) .Climate change trend in China, with improved accuracy. Clim Change 120:137-151(View Details)
Cite as:Zhao, N., Yue, T. (2016). < b>Monthly mean temperature for the period (1961-2010)</b>2016. doi: 10.3972/heihe.0034.2019.db. (Download the reference: RIS | Bibtex )
Using this data, the data citation is required to be referenced and the related literatures are suggested to be cited.
Terms of Use
To respect the intellectual property rights, protect the rights of data authors, expand services of the data center, and evaluate the application potential of data, data users should clearly indicate the source of the data and the author of the data in the research results generated by using the data (including published papers, articles, data products, and unpublished research reports, data products and other results). For re-posting (second or multiple releases) data, the author must also indicate the source of the original data.
Related Resources
Comments
Sign In to add comments
Keywords
Geographic coverage
| Spatial coverage |
East:101.5 South:38.0 |
West:98.0 North:42.0 |
|---|
Details
- Temporal resolution: Daily
- Spatial resolution: 100m - 1km
- Format: 栅格
- File size: 70.0 MB
- Browse count:10775
- Temporal coverage:1961-07-09 To 2011-07-08
- Access: Offline
- Updated time:2021-04-19
Authors
Resource Provider: ZHAO Na YUE Tianxiang

 Copyright ©right; 2017 - 中国科学院西北生态环境资源研究院 - 兰州数云软件科技有限公司提供技术支持