Monthly evapotranspiration dataset with 30m spatial resolution over oasis in the middle reaches of the Heihe River Basin Version 1.0 (2000-2013)

ET(Evapotranspiration)monitoring is essential for agricultural water management, regional water resources utilization planning, and socio-economic sustainable development.The limitations of the traditional monitoring ET method are mainly that large-area simultaneous observations cannot be made and can only be limited to observation points. Therefore, the cost of personnel and equipment is relatively high, and it is unable to provide ET data on the surface, nor to provide the ET data of different land use types and crop types.
Quantitative monitoring of ET can be achieved by remote sensing. The characteristics of remote sensing information are that it can reflect both the macroscopic structural characteristics of the Earth's surface and the microscopic local differences.
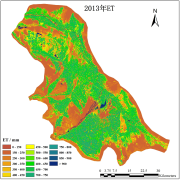
Monthly evapotranspiration datasets (2000-2013) with 30m spatial resolution over oasis in the Middle Reaches of Heihe River Basin Version 1.0 are based on multi-source remote sensing data. The latest ET Watch model is used to estimate the raster image data. Its temporal resolution is monthly and spatial resolution is 30 meters. The data cover the middle reaches of Zhangye oasis area in millimeters. The data types include month, quarter, and year data.
The projection information of the data is as follows:
Albers equivalent conical projection,
Central meridian: 110 degrees,
First secant: 25 degrees,
Second secant: 47 degrees,
Coordinate west deviation: 4000000 meters.
The file naming rules are as follows:
Monthly cumulative ET value file name: heihe-midoasis-30m_2013m01_eta.tif
Among them, heihe indicates the Heihe River Basin, midoasis indicates the middle oasis area, 30m indicates the resolution is 30 meters, 2013 indicates 2013, m01 indicates January, eta indicates actual evapotranspiration data, and tif indicates that the data is in tif format;
The ET value file for each season is named: heihe-midoasis-30m_2013s01_eta.tif
Among them, heihe indicates the Heihe River Basin, midoasis indicates the middle oasis area, 30m indicates the resolution is 30 meters, 2013 indicates 2013, s01 indicates 1-3 months, for the first quarter, eta indicates actual evapotranspiration data, and tif indicates that the data is in tif format;
The annual cumulative value file name: heihe-midoasis-30m_2013y_eta.tif
Among them, heihe indicates the Heihe River Basin, midoasis indicates the middle oasis area, 30m indicates the resolution is 30 meters, 2013 indicates 2013, y indicates the year, eta indicates the actual evapotranspiration data, and tif indicates that the data is in tif format.
Data Citations
Related Literatures:1. Liu S F, Xiong J and Wu B F. 2011. ETWatch: a method of multi-resolution ET data fusion. Journal of Remote Sensing,15(2): 255–269.(View Details)
Cite as:Wu, B. (2015). < b>Monthly evapotranspiration dataset with 30m spatial resolution over oasis in the middle reaches of the Heihe River Basin Version 1.0 (2000-2013)</b>2015. doi: 10.3972/heihe.1022.2015.db. (Download the reference: RIS | Bibtex )
Using this data, the data citation is required to be referenced and the related literatures are suggested to be cited.
References literature
1.Wu, B. , Yan, N. , Xiong, J. , Bastiaanssen, W. G. M. , Zhu, W. , & Stein, A. . (2012). Validation of etwatch using field measurements at diverse landscapes: a case study in hai basin of china. Journal of Hydrology, 436-437(none), 67-80. (View Details )
2.Zhu, W. , Wu, B. , Yan, N. , Feng, X. , & Xing, Q. . (2014). A method to estimate diurnal surface soil heat flux from modis data for a sparse vegetation and bare soil. Journal of Hydrology, 511, 139-150. (View Details )
3.Wu, B. , Xing, Q. , Yan, N. , Zhu, W. , & Zhuang, Q. . (2015). A linear relationship between temporal multiband modis brdf and aerodynamic roughness in hiwater wind gradient data. Geoscience and Remote Sensing Letters, IEEE, 12(3), 507-511. (View Details )
4.Feng,X.L, Wu,B.F,Yan,N.N, Zhu,W.W. Method to derived mixed boundary layer height from MODIS atmospheric profile data product at Heihe river basin. Boundary-layer Meteorology. Under Review. (View Details |Download)
5.Xiong, J. , Wu, B. F. , Yan, N. , Zeng, Y. , & Liu, S. . (2010). Estimation and validation of land surface evaporation using remote sensing and meteorological data in north china. Selected Topics in Applied Earth Observations and Remote Sensing, IEEE Journal of, 3(3), P.337-344. (View Details )
6.Zhang, H. , Wu, B. , Yan, N. , Zhu, W. , & Feng, X. . (2014). An improved satellite-based approach for estimating vapor pressure deficit from modis data. Journal of Geophysical Research: Atmospheres, 119(21), 12,256-12,271. (View Details )
Terms of Use
To respect the intellectual property rights, protect the rights of data authors, expand services of the data center, and evaluate the application potential of data, data users should clearly indicate the source of the data and the author of the data in the research results generated by using the data (including published papers, articles, data products, and unpublished research reports, data products and other results). For re-posting (second or multiple releases) data, the author must also indicate the source of the original data.
Related Resources
Comments
Sign In to add comments
Keywords
Geographic coverage
| Spatial coverage |
East:100.9 South:38.7 |
West:99.8 North:39.4 |
|---|
Details
- Format: 栅格数据
- File size: 7567.36 MB
- Browse count:11188
- Temporal coverage:2000-01-11 To 2014-01-10
- Access: Offline
- Updated time:2021-04-19
Authors
Resource Provider: WU Bingfang

 Copyright ©right; 2017 - 中国科学院西北生态环境资源研究院 - 兰州数云软件科技有限公司提供技术支持